
This project is a group project, finished by my teammate Wai Shing Wong and me. It's another application of Logistic binary regression. We are trying to predict whether a company from Tai Wan will be bankrupted or not based on many company financial features. Performed Logistic binomial regression to predict the response variable based on the best lambda according to AUC value to consult firms on bankruptcy risks and utilize this knowledge to short at-risk equities in the market
Dataset Summary
The dataset has 95 financial features, for example: Income, Cash flow, Liability, Turnover rate, etc. Total sample size is 6819, where 3.23% of them are bankrupted or their labels equal 1, 96.77% are non-bankrupted or their labels equal 0. We will take imbalance issue into consideration when we train the model. And we normalize all numerical features before we start to train. Consider the dataset is imbalanced, we use stratified sampling to split the train and test sets, let 90% of dataset be train set, and the rest be test set. After preprocessing the dataset, now we can train our model.
Model Training
In this project, we consider three different cost functions of Logistic Regression (Ridge, Lasso, Elastic-net) and Random Forest. We use ROC curve and AUC value, which is the area under the ROC curve, to measure the model performance. We randomly using stratified sampling to split dataset into train and test sets, use 10-fold cross-validation to tune the best hyperparameter to fit the model and calculate AUC value. However, in order to avoid the random error, we repeat the process 50 times and show the distribution of each model’s performance.
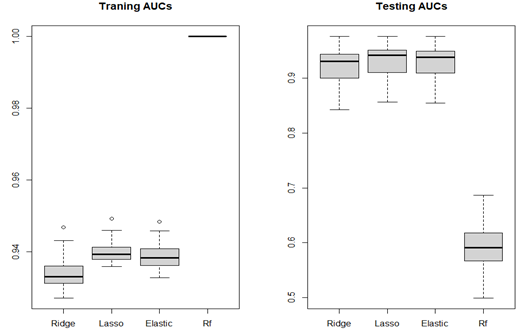
As we can see the bar plot above. The left side shows the AUC values of train set, Ridge, Lasso, Elastic-net perform similarly, the values of Random Forest are 1, which means if you use Random Forest to predict train set given you train the model by train set, all predictions will be correct. But in the right side, from the test set AUC values, Random forest performs badly comparing to it’s performance on train test, we call this situation overfitting. For the other three algorithms, the model performance on prediction is good and most of AUC values are above 0.9.
Next, we pick one of the 50 samples to show the process of tuning hyperparameter.
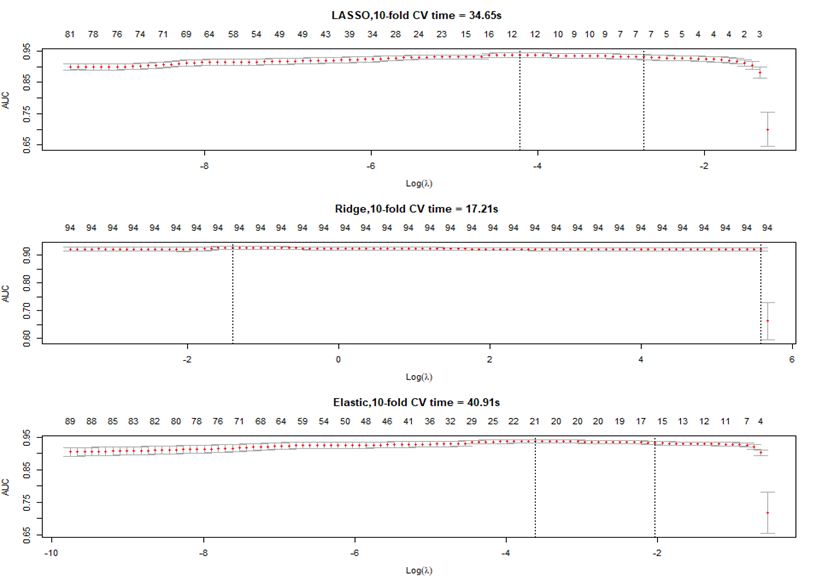
The number on the top means as the hyperparameter changing, how many features will remain in the model. And we want to tune the hyperparameter at which the model will have the largest AUC value. By default, cross-validation function in ‘glmnet’ package of R language will test 100 hyperparameters to find the best one. As we can see, different cost function tunes different range of hyperparameter within which AUC value reach its peak.
Model Selection
In the project IMDb Sentiment Analysis, we stop here because the three algorithms have similar performance, and we could not decide which one is the best. In this project, those three performances have similar and good performance as well, but we will consider the time consuming, model complexity and the scope of project to decide which one is more suitable.
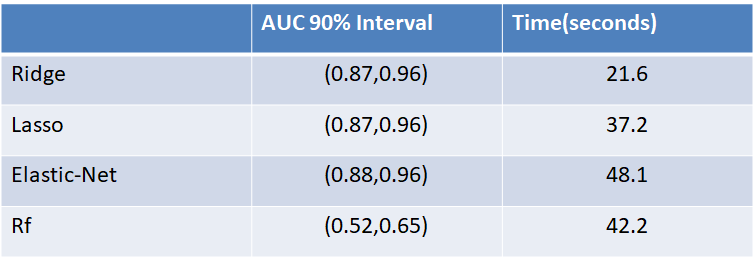
Firstly, we can see time to train the model does not positively correlate with model performance. For instance, Random Forest has the worst performance, but the time it consumed is much longer than Ridge and Lasso whose performances are much better. Secondly, given the first three algorithms have the similar performance, if we consider time consuming, we may choose Ridge regression for our project.
Now, we take model complexity into our consideration.
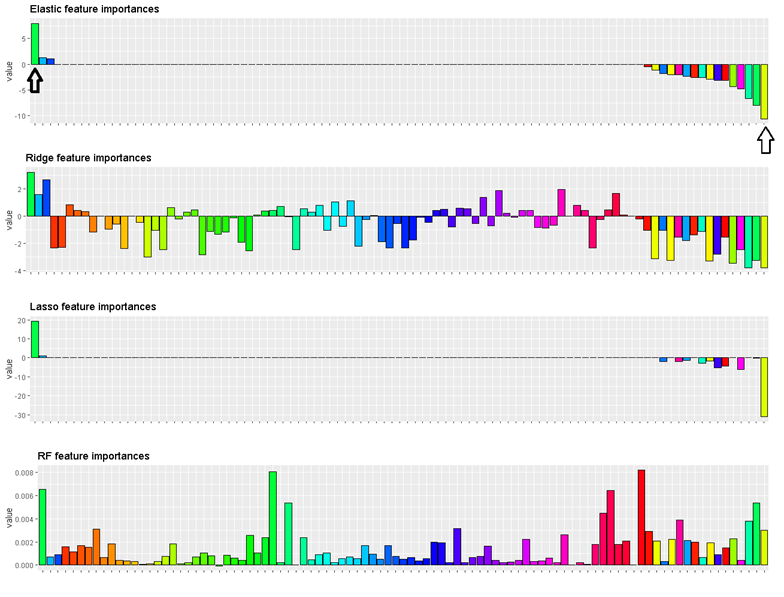
We do not consider Random Forest for now, because its bad performance on test set. Each feature in this bar plot, if bar is above horizontal line, it means this feature is positively related to more likely to classify the company to be bankrupted. And the length of a bar means the importance level of the feature to contribute to classification, or coefficient of feature.
Summary and Variable Selection
All features of Ridge regression have coefficients and of Lasso and Elastic-net, only a few features have coefficients, which makes the model simpler. When we build a model for a project, we always want a simple model whose performance is good. And the time consuming of Lasso is less than Elastic-net.
On the other hand, time is important also, but this project is not real-time stock price prediction in which the timing issue is much more important than model complexity if models have similar performance.
In the end, we will decide to use Lasso as our optimal model to predict Tai Wan Bankruptcy, so we only need to focus on few company’s financial features.That's also the results of variable selection, those few features that have relative large absolute values will be considered in our final predict model by which we reach the goal to reduce the model complexity and variable selection .The most positive feature is Liability/Total Asset (+) and the most negative feature is EPS-Net Income (-). For a company, as its liability/total asset is large, it more likely to file bankruptcy and if it’s EPS-net income is large, it less likely to file bankruptcy.