
This is the project that I campe up and completed when I attened the IBM Professional Data Scientist Certificate courses in Coursera. Even though my graduate major is data science, but I still learned a lot of new things from the courses. And this is the one of many projects I have completed through the course.
- Introduction
- Clarify Problems
- Data Preparation
- Solutions
- Results
- Discussion
- Conclusion
Introduction
When we decide to move to another city, many people, including me, have a similar concern that whether the new place I choose is suitable for me or not. Will I feel comfortable after I move there? For example, around my old apartment, there are several markets I can choose from, like Whole food, Target, Trader-joe. There is a park near my house, so I can take a walk through the park to enjoy myself, and on its way, I would buy a coffee or a bubble tea, etc. What if my new place does not have a park nearby, or drink shop, or I need to drive at least 30mins to the market just to get some mushrooms. Now, my tool can help here. The tool will take the name of your neighborhood where you live right now and the city you want to move to, then give you some recommendations that you are more likely satisfied with. In this sample project, we assume current house is in Westwood and destination is NYC.
Clarify Problems
- Get the coordinates of your old house and the city you want to move to.
- Identify the attributes of your old house.
- Cluster the neighborhoods of the future city into several clusters.
- Match your old house into one of those cluster.
- Give you recommendations which are all the neighborhoods in the cluster in the last step.
Data Preparation
In this sample project, I will only introduce New York City data set, which means we assume that the destination is NYC. And the venue’s data from foursquare.
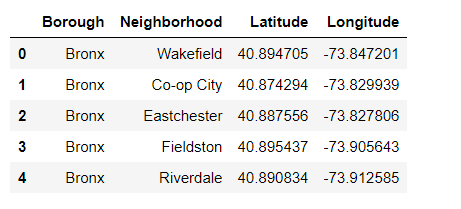
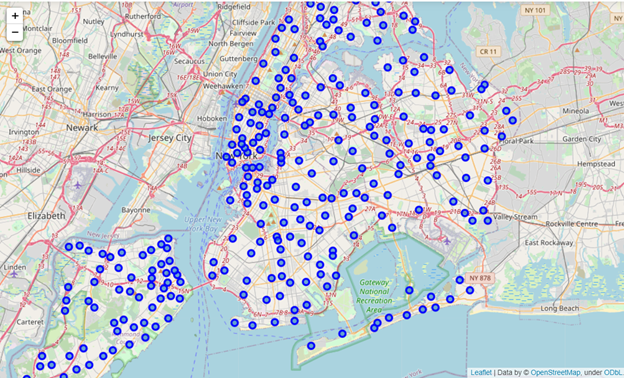
That is the data of neighborhoods info of NYC, it includes Borough, Neighborhood, and coordinate of the area. Based on the data we had, we can fetch the venue data from foursquare API. Here is the neighborhood map of NYC.
Data source:
New York Neighborhood Data
Foursquare
Solution
Data Preprocessing
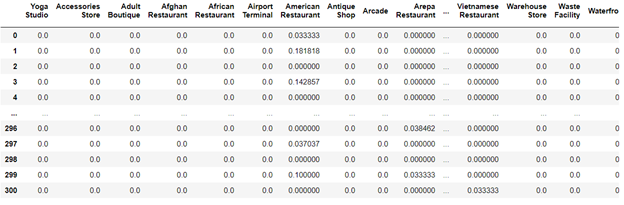
The data that collected from foursquare are text data and categorical data, so we need to use one-hot encoder to transform the data:
K Mean Clustering
We used K mean algorithm to cluster all neighborhoods of NYC and label them by using ‘sklearn’ package in Python. Then the data become labeled data, which can be used for supervised machine learning technique.
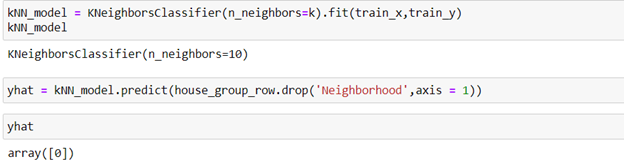
KNN Classification
As we had the labeled data from last step. Then we fetched venue data of location of your current house from API, and took the labeled data as training data set to build the KNN model, so that we can predict the label of your current house, in the end, we will recommend to you the neighborhoods in NYC, whose label are the same as the label of your house.
Result
K Mean Clustering:
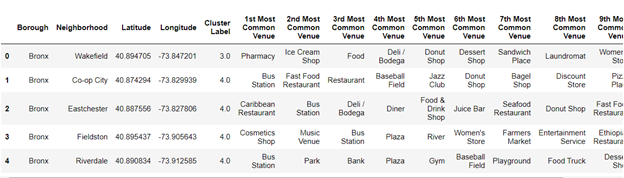
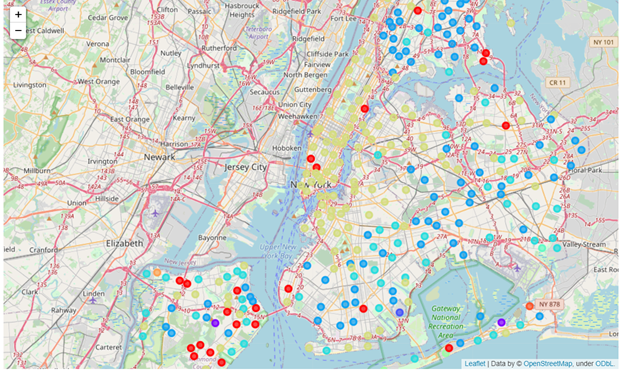
All neighborhoods are labeled and mapped by different colors.
KNN Classification:
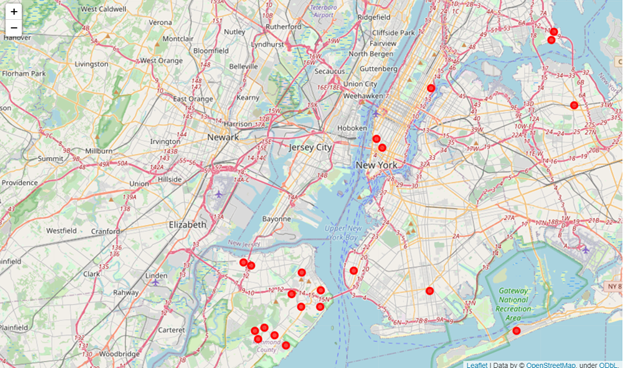
The KNN labeled Westwood as ‘0’, so the red dots in the map are the recommendations of our tool if you want to move to NYC and you are more likely feel comfortable as you are in Westwood.
Discussion
Data
Since the limitation of data resource, we only consider the NYC as destination and venues information as features. In the future improvement, we can add more cities into our destination list and enrich our features to make prediction more robust, for instance, crime rate, median price, rental price, number of hospitals, school rate, etc.
Algorithm
We used K mean to do clustering and KNN to classify. In the future exploration, we can try DBSN to cluster the neighborhood, logistic regression, random forest to do classification, and evaluation prediction performance and select the best model to robust the result of the tool.
Conclusion
We try to apply machine learning techniques to solve the real problem, get insights from mess data. Define problems, find solution, fetch data, analyze data, apply ML technique, and solve the problems. We made it. And this tool can be improved in many ways as mentioned in Discussion section.
In the end, thanks teachers in the IBM Couresra courses, thanks all peers that rated my submissions and shared your reviews with me.