
This project is from self-learning experience. The task is to use California census data to build a model of housing prices in the state. I will do the data visualization and variable selection, and then model selection among several ML models based on their performances.
Dataset Summary
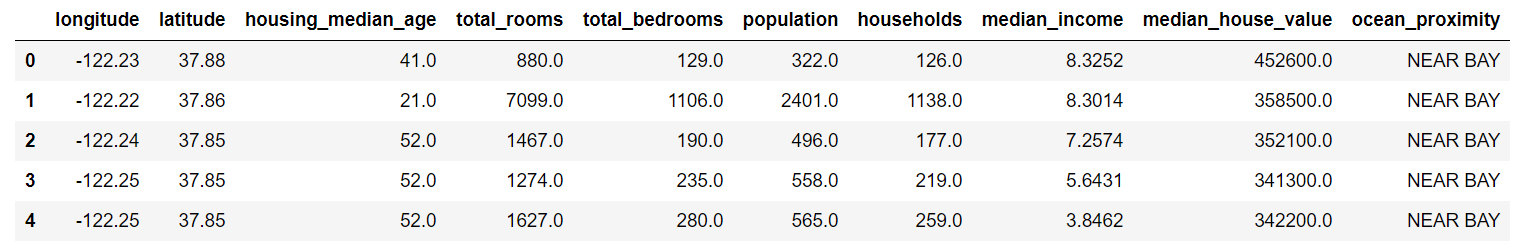
The data includes metrics such as population, median income, location, and median housing price for each block group in California. There are 20640 instances in the datasets and 10 attributes including both numerical variables and categorical variables.
Links to data source:
https://raw.githubusercontent.com/ageron/handson-ml2/master/datasets/housing/housing.tgz
Here is the sample picture of the datasets that I will use in this project:
Data Visualization
Since the data contains location information and also population, so the plot that demonstrates the relationship among location, population density and housing price will be nice.
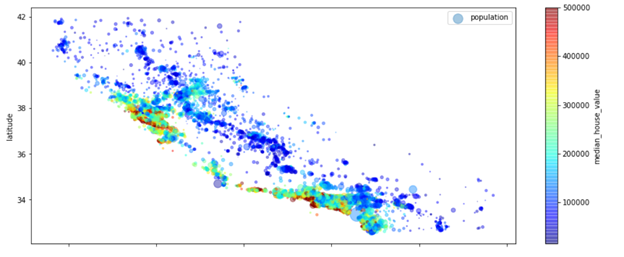
As the plot shown above, red dots are expensive and blue ones are cheap. Larger circles indicates that the lager population in that area. From the plot, we can know the housing price is related to location and population density.
Variables Correlation and Data Cleaning
For variable selection, the correlation map will be my first consideration to see the relationship between dependent variable and each independent variable.
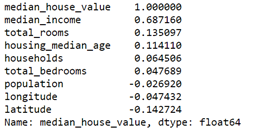
Then select the features that have large absolute correlation coefficients to draw the matrix plot.
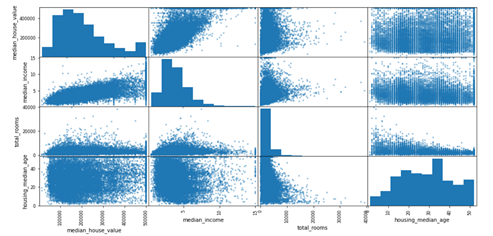
Now, we have some basic sense of the relationship between dependent variable and numerical variables. After imputing the missing data, we then did transformation. For categorical variables, we used one-hot encoding method to transform the categorical variables which is ocean_proximity in the case and used standardized normalization to transform the numerical data. In the end, the data is ready to train the ML models.
Model Training and Selection
After data preprocessing, we trained three models which are linear regression model, decision tree model and random forest model using sklearn package in Python. We used 10-fold Cross-Validation and RMSE, root mean squared error, to measure the model performance. And we have the output table as shown below:
|
|
Training sets |
Testing sets |
||||
|
|
RMSE |
CV scores mean |
CV score std |
RMSE |
CV scores mean |
CV score std |
|
Linear reg |
69050 |
69223 |
2657 |
67352 |
67630 |
2568 |
|
Decision Tree |
0 |
69927 |
2690 |
74400 |
73493 |
5311 |
|
Random Forest |
18307 |
49482 |
1859 |
53983 |
53950 |
2425 |
We started from the training datasets. In the training datasets, Decision tree model has the smallest RMSE because the nature of decision tree that usually has overfitting problem and will lead to higher variance in testing datasets. That’s why we also used CV scores to measure the performance. As we can see in the table under training sets and cv scores, decision tree has the worse score. Let’s look at linear model and random forest model. Random forest is nothing but many decision trees on random subset and then averaging out their predictions. In this case, random forest has smaller RMSE than linear model, and has smaller CV scores mean. From training sets performance test, we think random forest is the best model among them. Then, we also need to check the testing set. There is no surprise that decision tree has the highest RMSE because of overfitting problem, and random forest model is the best model as it is in training set.
Importance of variables
Once we tuned our best models, we can check the importance of all independent variables.
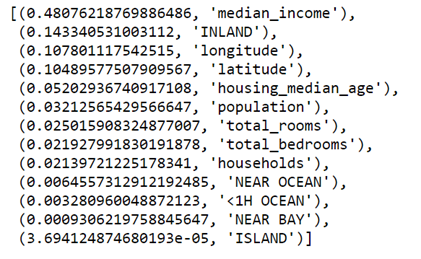
As we can see, the median income has the largest contribution to house price, and then followed by house location. For example, median income increases by 1 unit, the house price will increase by 0.48 unit. And number of households seems less useful.
Summary
By using Python script, we fetched data and cleaned the data to build three ML models to predict median house price in California. We tuned the random forest model is the best one based on RMSE and 10-fold cross-validation score. In the end, we found out that median income is the most important variable to determine the house price. In the further working, I may try to use the population density instead of population, and total rooms per person instead of total rooms and household columns to see if it will make any difference on the results.