
This is the first real world project I attended in the financial area. My internship in Prospect 33 began in the end of May 2020 when the Covid19 has killed so many people in the world, and it’s becoming a big concern in America. Doing something meaningful to prevent people from virus and applying what I learned from school driven me into this amazing team.
Dataset Summary
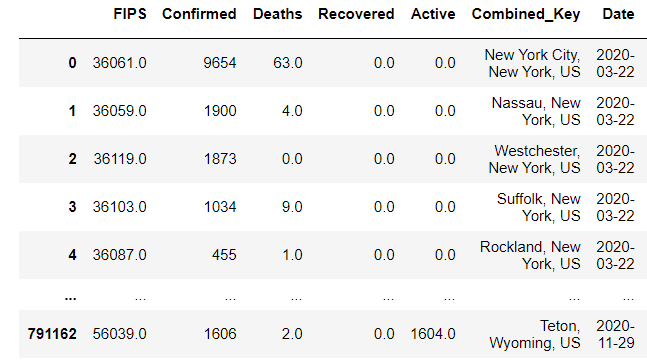
We have a cron job script to pull data daily for every county in the US from the Johns Hopkins GitHub site. It contains number of total deaths, total confirmed cases, new deaths, new confirmed cases, etc. But we could not find a reliable data source has daily recovery data, so we decide to make up the recovery data from the data we have based on some assumptions.
Here is the example:
Model Assumptions
- The data from JHU is reliable and correct.
- Only analyze the county whose total confirmed cases >=250.
- The model output is estimated infected cases, which equal to: total confirmed – total deaths – total recovery cases.
- 80% of new cases will be either dead or recovered in two weeks, the rest 20% will be either dead or recovered in the next week (the third week).
- Infected case depends on last 7 days’ infected number.
- Use 7-days moving average to calculate beta and gamma for SIR model and Rt.
Model Selection
We assume infected case depends on last 7 days’ data, so we want to build a regression model to predict it, after model validation, we finally choose Ridge regression to fit the data. And then do prediction for 2-weeks period, after that, generate beta and gamma at the end of prediction and plug in SIR model to simulate for 100 days.
Reference:SIR Model, Time_Dependent Paper
How to Use Our Tool:
Click here to our website directly-->Daily Updated Info
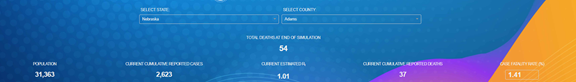
We will update the common data daily like cumulative reported cases, cumulative deaths, estimated Rt and case fatality rate. You can select any county of America in the drop box menu only if the number of total confirmed cases of the county is larger than 250. Also, you can change case fatality rate to see how the projection and simulation will change.
Intervention

In the bottom of our tool, you can set intervention date to after the prediction period ends, then use the slider to increase or decrease Rt, which is the value you are targeting based on social distancing, mask wearing, etc. There are upper and lower bounds set according to the county so that the Rt remains in a realistic range for that county’s situation. When Rt larger than 1, infected cases will go up, and when Rt less than 1, infected cases will decrease.
Projection and Simulation
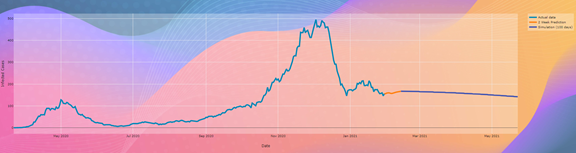
When you set up all intervention parameters or leave them by default. You will see the projection and simulation plot like the picture above. You may notice the orange line in the middle, that’s 2-weeks projection, the light blue line before that is estimated infected cases, and the deep blue line after is SIR model simulation output.